Find this screen
Open: Settings > Cash Book / Nominal Ledger > Financial Statement Layouts.
Note: This topic describes financial statements for Report Designer. If you want to produce financial statements for Excel Reporting, see How to design layouts for financial data reports (Excel Reporting).
Add or amend a layout
- Choose the type of layout you need, from
- For a new layout, click New and enter a name.
- To copy the sample layout, select it and click Copy, and enter a name.
- Select the layout and click Edit.
Tip: If you just want to make a changes to the layout provided, copy the sample layout, give it a new name and select Edit.
Add text lines
Use text lines to create headings, subheadings or to add notes. Use these to create blanks lines or just add a line of dashes to break up the report.
- Change an and existing line, or click Insert to add a new one.
- In the Type column select Text.
- In the Title column, enter the required Text. Leave empty for a blank line.
- Choose a Heading style. This controls the font and style for the text. These styles are set in Report Designer.

Add account groups (nominal accounts)
This is where you add the totals for your nominal accounts. Account totals are added per report category
You choose from the report categories for the layout you creating. So if you're creating a Balance Sheet, only report categories with a Type of Balance Sheet are shown in the drop-down lists.
Note: You can' t add single nominal accounts.

Single or multiple report categories?
When you add report categories to the layout, you can choose from the following:
-
Single account group: Use this to display the total of for a single report category.
See an exampleYou want to display the totals of your salaries for each type of staff separately on you Income and Expenditure reports. You add report category E01 to the report. This displays the totals of the following nominal accounts:
Nominal account code Description Report category 70201 Teachers Gross Pay E01 - Teaching Staff 70202 Teachers NIC E01 - Teaching Staff 70203 Teachers Pensions E01 - Teaching Staff See an exampleYou want to display the total for your product sales and export sales separately. You add report category 400 to the layout. The total of the following nominal accounts is shown on the report:
Nominal account code Description Report category 4000 Default Sales 400 - Product sales 4001 Sales Type B 400 - Product sales 4002 Sales Type C 400 - Product sales 4008 Discounts Allowed 400 - Product sales -
Multiple Account Group: Use this to add a range of report category codes.
See an exampleYou want to display the total of all staff salaries as a single value. You add report categories E01 to E03
The total of the following accounts is shown on the report
Nominal account code Description Report category 70201 Teachers Gross Pay E01 - Teaching Staff 70202 Teachers NIC E01 - Teaching Staff 70203 Teachers Pensions E01 - Teaching Staff 70301 Supply Staff Gross Pay E02 - Supply Staff 70302 Supply Staff NIC E02 - Supply Staff 70303 Supply Staff Pensions E02 - Supply Staff 70401 Admin Staff Gross Pay E03 - Admin Staff 70402 Admin Staff NIC E03 - Admin Staff 70403 Admin Staff Pensions E03 - Admin Staff See an exampleYou want to display the total value for all your sales, product and export. You add report categories 400 and 410. The total of the following nominal accounts is shown on the report:
Nominal account code Description Report category 4000 Default Sales 400 - Product sales 4001 Sales Type B 400 - Product sales 4002 Sales Type C 400 - Product sales 4008 Discounts Allowed 400 - Product sales 4100 Sales Type D 410 - Export Sales 4101 Sales Type E 410 - Export Sales
To add accounts
- Change an existing line, or click Insert to add a new one.
- In the Type column:
- For one report category, select Single Account Group.
- To add several report categories together, select Multiple Account Group.
- In the Category column, choose the report category(s).
- In the Title column, enter a label or description.
- Choose whether the total is expected to be a Debit or Credit. If the total value is not as expected, the value displays in brackets.
- Choose whether the total value should aligned to the Left or Right of the column.
- To show the value as a percentage of the next subtotal, choose Yes in the Base column
Is it a debit or credit?
When you add report categories and subtotals, you decide whether the value should being displayed is a Debit or a Credit. This controls whether the value is a plus or minus. You should choose the one that you expect the value to be.

The values should be displayed as follows for normal accounting practices:
Profit and Loss
Income and Expenditure
- Income
- Expenses
- Gross profit - Debit
- Net income (income less expenses) - Debit
- Net profit - Debit
Balance Sheet
- Assets - Debit
- Liabilities - Credit
- Capital and reserves - Credit
- Assets less liabilities - Debit
- Total capital and reserves - Credit
SOFA report
- Income and endowments - Credit
- Expenditure - Debit
- Net income - Credit
- Transfers between funds -Debit
- Gains / looses on pensions schemes - Debit
- Fund brought forward - Debit
- Total funds carried forward - Credit
If the total value of the nominal accounts is not as expected, the value displays in brackets. For example, if you have negative sales or make a loss.
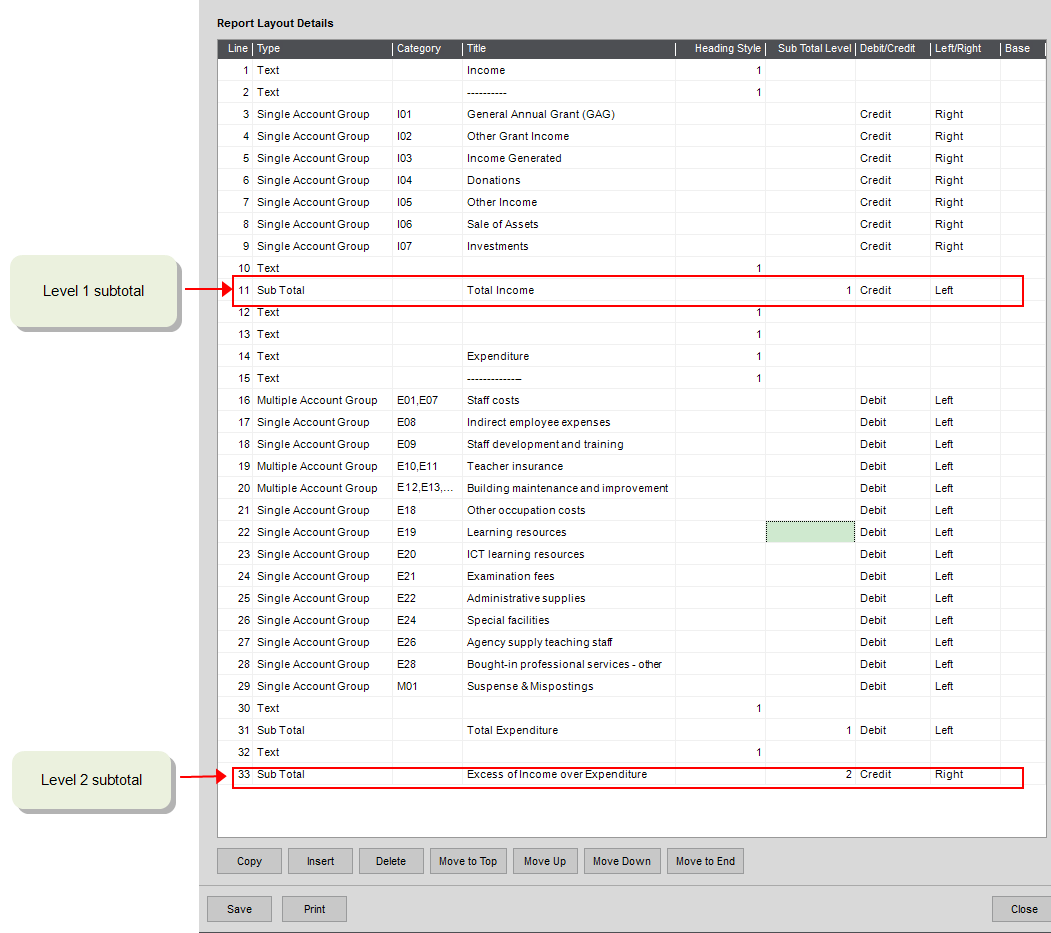
Add subtotals
A Sub Total row add other lines and sections together to create your report totals. You specify a subtotal level (1-9) to choose which rows are added up and included in the total:
- 1 - Adds the rows above not included in another sub total.
- 2 - Adds the rows above not included in a level 2 sub total. This includes level 1 sub totals.
- 3 - Adds the rows above not included in a level 3 sub total.
- 4 - Adds the rows above not included in a level 4 sub total, and so on.

For the profit and loss, you want to show the total value of sales and direct expenses, then calculate your gross profit. You then want to add up your overheads and calculate your net profit.
To add up your sales use subtotal level 1. This totals the report categories above, in this example, Product sales and export sales.
| Sales | ||
|---|---|---|
| Product Sales | 100,000 | |
| Export Sales | 35,000 | |
| Total sales | 135,000 | (Subtotal heading 1) |
To add up your direct expenses also use subtotal level 1. This adds up all rows above not included in a subtotal. As your sales re already included in level 1 subtotal, they're not included in this one.
If you use a higher subtotal level it will include the value of lower subtotal levels above, i.e. your sales.
| Direct expenses | ||
|---|---|---|
| Purchases | 25,000 | |
| Sales Commission | 10,000 | |
| Total direct expenses | 35,000 | (Subtotal heading 1) |
To calculate your gross profit, use subtotal level 2. This adds up all rows above not included in a level 2 subtotal. As neither your sales or direct expenses are included in a level 2 subtotal so far, this ads your sales (credit) to your expense (debit).
| Gross Profit | ||
|---|---|---|
| 100,000 | (subtotal level 2) |
To calculate your overheads use subtotal level 1. Again the section above that have already been totalled using a subtotal level 1 are ignored, so only your Overheads are totalled.
If you use a higher subtotal level it will include the value of lower subtotal levels above, i.e. your sales.
| Overheads | ||
|---|---|---|
| Wages | 25,000 | |
| Rent | 10,000 | |
| Office expenses | 5,000 | |
| Total overheads | 40,000 | (Subtotal heading 1) |
To calculate your net profit, use subtotal 3. This adds up all rows above not included in a level 3 subtotal. As neither your sales or direct expenses are included in a level 3 subtotal so far, this adds your sales (credit) to your expenses (debit) and overheads (debit).
| Net Profit | ||
|---|---|---|
| 60,000 | (subtotal level 3) |
For the income and expenditure, you want to show the total value of income, the total value of expenditure and the net remaining income.
To add up your income use subtotal level 1. This totals the report categories above, in this example, General Annual Grant, Other Grant income and Donations.
| Income | ||
|---|---|---|
| General Annual Grant | 100,000 | |
| Other grant income | 25,000 | |
| Donations | 10,000 | |
| Total sales | 135,000 | (Subtotal heading 1) |
To add up your expenses also use subtotal level 1. This adds up all rows above not included in a subtotal. As your income is already included in level 1 subtotal, it's not included in this one.
If you use a higher subtotal level it will include the value of lower subtotal levels above, i.e. your sales.
| Expenses | ||
|---|---|---|
| Teaching Staff | 100,000 | |
| Building maintenance | 15,000 | |
| Resources | 10,000 | |
| Total direct expenses | 125,000 | (Subtotal heading 1) |
Applying percentages to subtotals
You can show the values as a percentage of a subtotal on the report. To do this:
-
Choose the sub total that you want to use as the base. All other values on the report are shown as a percentage of this sub total.
Note: You can only set one sub total as the base.
-
Print the Profit and Loss report that contains a percentage column.
Reports with percentage columns:
- Profit and Loss Report (MTD - YTD Percentages).
- Profit and Loss Report (MTD - YTD Percentages) by Cost Centre.
If you want to add a percentage column to other reports, you'll need to add a percentage column using Report Designer.

To add a sub total line
These add other lines or sections together to create your report totals.
- Change an existing line, or click Insert to add a new one.
- In the Type column select Sub Total.
- In the Title column, enter a description.
- In the Sub Total Level, enter a number between 1 and 9. The totals are added up as follows:
- 1 - Adds the rows above not included in another sub total.
- 2 - Adds the rows above not included in a level 2 sub total. This includes level 1 subtotals.
- 3 - Adds the rows above not included in a level 3 sub total.
- 4 - Adds the rows above not included in a level 4 sub total, and so on.
- Choose whether the total is expected to be a Debit or Credit. If the total value is not as expected, the value displays in brackets.
- Choose whether the total value should align to the Left or Right of the column.
- To show the value as a percentage of the next sub total, choose Yes in the Base column
Validate the layout
This checks that all your report categories have been added to the layout, and have only been added once.
Note: You can't validate the SOFA report layout.
- Select the layout and click Validate.
-
The validation results will list any report categories that have:
- Been used more than once, with the number of Times Used.
- Not been used at all.
Tip: To keep a copy of these validation results, you can right-click the list and select Export > All to Excel.
Import or export a layout
If you want to share layouts between companies, you can import and export layouts. This saves the layout as a CSV file, so you can edit it using Excel.
Note: You can import and layouts for your
Open: Settings > Cash Book / Nominal Ledger > Financial Statement Layouts.
-
Choose the layout.
-
Click Import or Export.
-
Choose the filename and location of the layout.
What does the CSV file look like?
To get an idea what the CSV file will looks like, see this example CSV file for the Profit and Loss financial layout.
One header line of identifiers is required in this order:
- "Line", "Type", "Category", "Title", "Heading Style", "Subtotal Level", "Debit\Credit", "Left\Right", "Base".
The lines are the report lines you want to generate:
| Column heading | Required entry | Notes |
|---|---|---|
| Line | Ascending number | e.g. the first line is 1, the second 2 and so on |
| Type |
|
Specifies the contents of the row. Case and spacing should be as specified. |
| Category | Report category code e.g. 401 | |
| Heading Style | A number from 1 to 9 |
|
| Subtotal Level | A number from 1 to 9. |
|
| Debit\Credit | Debit or Credit | |
| Left\Right | Left or Right. | |
| Base | Yes or No |
Note: If you create a CSV file manually to import, you must ensure that you use the correct case for the entries in the CSV file or you will not be able to import the file. For example, when entering the Type, enter SubTotal and not Subtotal.
Useful Info
About report categories
Report categories are used to group your nominal accounts on your financial statements. Each category determines whether an account is for income or expenditure (Profit and Loss), or for your assets and liabilities (Balance sheet).
Every nominal account must have a report category, as this determines which report the balance of the account is included on and how it's reported.
Adding and amending report categories
When you first set up Sage 200, we provided a set of report categories for you to reflect the broad group of things required by most
For maintained schools, these report categories match the CFR codes. For academies, these are categories common for most schools.
Tip: If you add your own report categories, make sure you also add them to your Financial Statement layouts (printed reports) and the Financial Statement Designer Excel reports).
CFR codes for Income and Expenditure
| Code | Name | Type | Category Type |
|---|---|---|---|
| CE00 | De minimis levels for capitalising expenditure | Profit and Loss | Expense |
| CE01 | Acquisition of land and existing buildings | Profit and Loss | Expense |
| CE02 | New construction, conversion and renovation | Profit and Loss | Expense |
| CE03 | Vehicles, plant, equipment and machinery | Profit and Loss | Expense |
| CE04 | Information and communication technology | Profit and Loss | Expense |
| CI01 | Capital income | Profit and Loss | Income |
| CI03 | Voluntary or private income | Profit and Loss | Income |
| CI04 | Direct revenue financing | Profit and Loss | Income |
| E01 |
Teaching staff - |
Profit and Loss | Expense |
| E02 | Supply teaching staff | Profit and Loss | Expense |
| E03 | Education support staff | Profit and Loss | Expense |
| E04 | Premises staff | Profit and Loss | Expense |
| E05 | Administrative and clerical staff | Profit and Loss | Expense |
| E06 | Catering staff | Profit and Loss | Expense |
| E07 | Cost of other staff | Profit and Loss | Expense |
| E08 | Indirect employee expenses | Profit and Loss | Expense |
| E09 | Staff development and training | Profit and Loss | Expense |
| E10 | Supply teacher insurance | Profit and Loss | Expense |
| E11 | Staff-related insurance | Profit and Loss | Expense |
| E12 | Building maintenance and improvement | Profit and Loss | Expense |
| E13 | Grounds maintenance and improvement | Profit and Loss | Expense |
| E14 | Cleaning and caretaking | Profit and Loss | Expense |
| E15 | Water and sewerage | Profit and Loss | Expense |
| E16 | Energy | Profit and Loss | Expense |
| E17 | Rates | Profit and Loss | Expense |
| E18 | Other occupation costs | Profit and Loss | Expense |
| E19 | Learning resources | Profit and Loss | Expense |
| E20 | ICT learning resources | Profit and Loss | Expense |
| E21 | Examination fees | Profit and Loss | Expense |
| E22 | Administrative supplies | Profit and Loss | Expense |
| E23 | Other insurance premiums | Profit and Loss | Expense |
| E24 | Special facilities | Profit and Loss | Expense |
| E25 | Catering supplies | Profit and Loss | Expense |
| E26 | Agency supply teaching staff | Profit and Loss | Expense |
| E27 | Bought-in professional services -curriculum | Profit and Loss | Expense |
| E28 | Bought-in professional services - other | Profit and Loss | Expense |
| E29 | Loan interest | Profit and Loss | Expense |
| E30 | Direct revenue financing (revenue contributions to capital) | Profit and Loss | Expense |
| E31 | Community-focused school staff | Profit and Loss | Expense |
| E32 | Community-focused school costs | Profit and Loss | Expense |
| I01 | Funds delegated by the local authority | Profit and Loss | Income |
| I02 | Funding for sixth form students | Profit and Loss | Income |
| I03 | High needs top-up funding | Profit and Loss | Income |
| I04 | Funding for minority ethnic pupils | Profit and Loss | Income |
| I05 | Pupil premium | Profit and Loss | Income |
| I06 | Other government grants | Profit and Loss | Income |
| I07 | Other grants and payments received | Profit and Loss | Income |
| I08 | Income from facilities and services | Profit and Loss | Income |
| I09 | Income from catering | Profit and Loss | Income |
| I10 | Receipts from supply teacher insurance claims | Profit and Loss | Income |
| I11 | Receipts from other insurance claims | Profit and Loss | Income |
| I12 | Income from contributions to visits | Profit and Loss | Income |
| I13 | Donations and/or voluntary funds | Profit and Loss | Income |
| I15 | Pupil-focused extended school funding and or grants | Profit and Loss | Income |
| I16 | Community focused school funding and or grants | Profit and Loss | Income |
| I17 | Community-focused school facilities income | Profit and Loss | Income |
| I18 | Additional grant for schools | Profit and Loss | Income |
Additional report categories for the Balance Sheet and control accounts
| Code | Name | Type | Category Type |
|---|---|---|---|
| BS01 | Property | Balance Sheet | Asset |
| BS02 | Office Equipment | Balance Sheet | Asset |
| BS03 | Furniture and Fixtures | Balance Sheet | Asset |
| BS04 | Motor Vehicles | Balance Sheet | Asset |
| BS05 | Stock | Balance Sheet | Asset |
| BS06 | Debtors | Balance Sheet | Asset |
| BS07 | Deposits and Cash | Balance Sheet | Asset |
| BS08 | Creditors (Short Term) | Balance Sheet | Liability |
| BS09 | VAT Liability | Balance Sheet | Liability |
| BS10 | Taxation | Balance Sheet | Liability |
| BS11 | Wages | Balance Sheet | Liability |
| BS12 | Creditors (Long term) | Balance Sheet | Liability |
| BS13 | P & L Account | Balance Sheet | Liability |
| M01 | Bad Debt | Profit and Loss | Expense |
| M02 | Suspense | Profit and Loss | Expense |
| Code | Description | Type | Category Type |
|---|---|---|---|
| BS01 | Freehold Property | Balance Sheet | Asset |
| BS02 | Freehold Property Depreciation | Balance Sheet | Asset |
| BS03 | Leasehold Property | Balance Sheet | Asset |
| BS04 | Leasehold Property Depreciation | Balance Sheet | Asset |
| BS05 | Office Equipment | Balance Sheet | Asset |
| BS06 | Office Equipment Depreciation | Balance Sheet | Asset |
| BS07 | Furniture and Fixtures | Balance Sheet | Asset |
| BS08 | Furniture and Fixtures Depreciation | Balance Sheet | Asset |
| BS09 | Motor Vehicles | Balance Sheet | Asset |
| BS10 | Motor Vehicles Depreciation | Balance Sheet | Asset |
| BS11 | Computer Equipment and Software | Balance Sheet | Asset |
| BS12 | Computer Equipment and Software Depreciation | Balance Sheet | Asset |
| BS13 | Stock | Balance Sheet | Asset |
| BS14 | Debtors | Balance Sheet | Asset |
| BS15 | Bank Account | Balance Sheet | Asset |
| BS16 | Deposits and Cash | Balance Sheet | Asset |
| BS17 | Creditors: Short Term | Balance Sheet | Liability |
| BS18 | VAT Liability | Balance Sheet | Liability |
| BS19 | Taxation | Balance Sheet | Liability |
| BS20 | Wages | Balance Sheet | Liability |
| BS21 | Pension | Balance Sheet | Liability |
| BS22 | Creditors: Long Term | Balance Sheet | Liability |
| BS23 | Reserves | Balance Sheet | Liability |
| E01 | Curriculum Supplies | Profit and Loss | Income |
| E02 | Library Services | Profit and Loss | Expense |
| E03 | Assessment & Examination | Profit and Loss | Expense |
| E04 | School Fabric | Profit and Loss | Expense |
| E05 | School Office | Profit and Loss | Expense |
| E06 | ICT Expenditure | Profit and Loss | Expense |
| E07 | School Trips | Profit and Loss | Expense |
| E08 | Headteacher's Contingency | Profit and Loss | Expense |
| E09 | Governors' Provisions | Profit and Loss | Expense |
| E10 | Student Bursary Payments | Profit and Loss | Expense |
| E11 | Exclusion Costs | Profit and Loss | Expense |
| E12 | After-School Club Expenditure | Profit and Loss | Expense |
| E13 | Purchases | Profit and Loss | Expense |
| E14 | Charitable Donations | Profit and Loss | Expense |
| E15 | Other Expenditure | Profit and Loss | Expense |
| E16 | Building Projects | Profit and Loss | Expense |
| E17 | PFI | Profit and Loss | Expense |
| E18 | Building & Grounds | Profit and Loss | Expense |
| E19 | Staffing Costs | Profit and Loss | Expense |
| E20 | Catering Costs | Profit and Loss | Expense |
| E21 | Heat, Light and Power | Profit and Loss | Expense |
| E22 | Rent and Rates | Profit and Loss | Expense |
| E23 | Professional Fees | Profit and Loss | Expense |
| E24 | Travel Expenses | Profit and Loss | Expense |
| E25 | Motor Expenses | Profit and Loss | Expense |
| E26 | Bank Charges and Interest | Profit and Loss | Expense |
| E27 | Depreciation | Profit and Loss | Expense |
| E28 | Non-Reclaimable VAT | Profit and Loss | Expense |
| E29 | Bad Debts | Profit and Loss | Expense |
| I01 | General Annual Grant (GAG) | Profit and Loss | Income |
| I02 | Other Grant Income | Profit and Loss | Income |
| I03 | Income Generated | Profit and Loss | Income |
| I04 | Donations | Profit and Loss | Income |
| I05 | Other Income | Profit and Loss | Income |
| I06 | Sale of Assets | Profit and Loss | Income |
| I07 | Investments | Profit and Loss | Income |
| M01 | Suspense | Profit and Loss | Expense |
About SOFA categories
SOFA categories are only required if you're an academy. They're used to group your nominal accounts together to be included on the SOFA report.
An account balance will only be included on the SOFA report, if the nominal account has a Cost Centre and a SOFA category.
As a general rule, all nominal accounts with a Cost Centre and a Profit and Loss report category, will require a SOFA category. You'll also need some additional Balance Sheet nominal accounts for the transfer of funds, pensions benefits and funds brought forward from a previous year. See About the SOFA report.
A predefined set of SOFA categories has been created for you. These are taken from SORP 2015.
| Code | Description | Type | Category Type |
|---|---|---|---|
| SE01 | Raising funds | SOFA | Expense |
| SE02 | Academy trust educational operations | SOFA | Expense |
| SE03 | Provision on boarding activities | SOFA | Expense |
| SE04 | Other | SOFA | Expense |
| SI01 | Donations and capital grants | SOFA | Income |
| SI02 | Transfer from local authority on conversion | SOFA | Income |
| SI03 | Funding for the academy trusts educational operations | SOFA | Income |
| SI04 | Provision of boarding activities | SOFA | Income |
| SI05 | Other trading activities | SOFA | Income |
| SI06 | Investments | SOFA | Income |
| SX97 | Transfers between funds | SOFA | Asset |
| SX98 | Actuarial (losses)/gains on defined pension schemes | SOFA | Asset |
| SX99 | Funds brought forward | SOFA | Asset |
Fix it
I can't find a report category
This may be because the report category you're looking for has the wrong Type.
Only report categories with a Type of Profit and Loss can be selected on a Profit and Loss layout, and for Balance Sheet, report categories must have Balance Sheet as the Type.
Make sure the report category you're looking for has the correct type.
The value is displayed in brackets
This happens when you've specified that the value on a row should be a debit or credit but the actual value is the opposite. For example, if your total sales are a debit value when they should be a credit.
If you have negative sales then this is correct. If the value is displaying incorrectly, then make sure you've selected Debit or Credit correctly in the layout.
The value of some nominal accounts is not included
This happens if you haven't included all report categories in the layout.
To make sure that you've included all the relevant report categories, select the layout and click Validate.